Australian Councils Q1 2024 Call Centre Rankings
Introduction
In August 2023, we commenced mystery shopping calls to a minimum of six different Councils across Australia every month to provide Voice of Customer (VoC) insights into the performance of Australian Council’s call centre channel for consumers and add additional value for ACXPA Members who are seeking regular, independent industry benchmarking data based on real calls, not self-reported information.
We pose as real customers and assess the accessibility (how easy it was to connect to a live agent) and the customer service/quality of the interaction using over 80 different performance metrics as defined in the Australian Contact Centre Quality Standards.
We use a range of different scenarios when contacting the Councils, including waste enquiries, rates enquiries, information about upcoming local events, etc.
Average Council sector data is published monthly for ACXPA Members, and we publicly release a quarterly report (like this) containing Council sector averages and a small sample of the results for three individual Councils.
Councilsthat purchase the Contact Centre CX Benchmarking report to receive data for all 80 metrics for their contact centre each month, call recordings, assessors’ notes, trend data and benchmarking data for any five councils they nominate. Learn more >
Scroll below for additional insights or use the links below to jump directly to a section.
Jump Straight to a Section:
EXECUTIVE SUMMARY Q1 2024
Of the six industry sectors we currently assess (Banks, Car Insurance, Councils, Energy Retailers, Internet Retailers, and TAFEs), Australian Councils were ranked the second highest sector overall for Q1 2024 with a score of 57.6% (the highest was Internet Retailers on 61.9%).
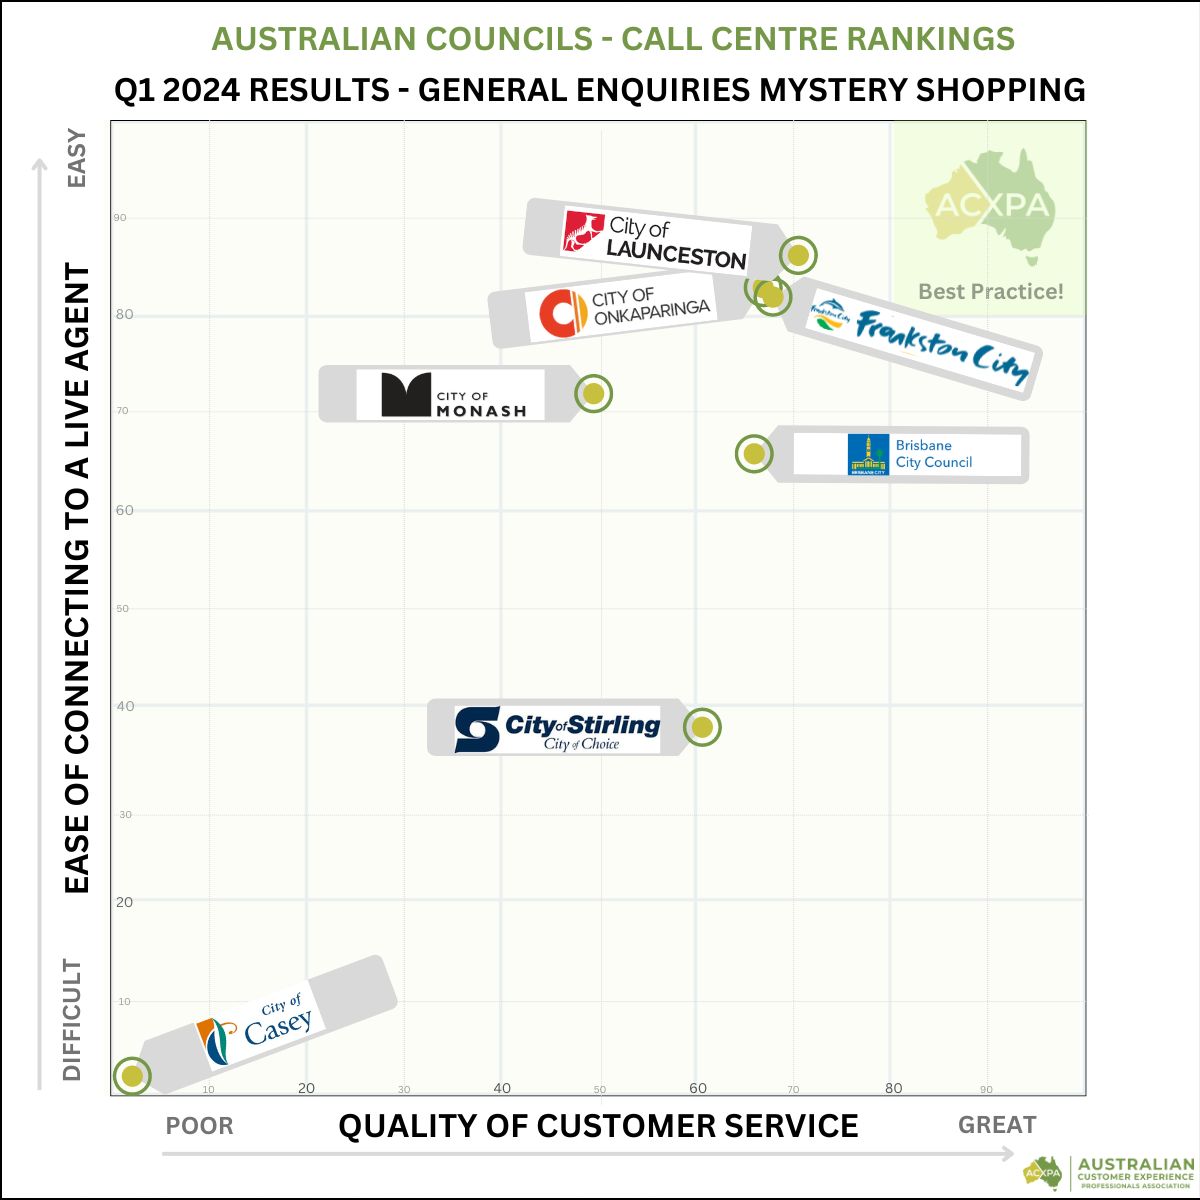
- The Overall ranking score for Australian Councils in Q1 2024 was 57.6% with scores for individual councils ranging from 0.0% (City of Casey, Victoria) to 74.8% (Launceston Council, Tasmania).
- Access rankings for the Council sector (how easy it was to connect to a live person) were rated at 61.1%, with scores ranging from 0.6% (City of Casey, Victoria) to 85.1% (Launceston Council, Tasmania). Councils were rated 3rd of the six industry sectors we measured – for comparison, the highest sector for Q1 2024 for Access was Internet Retailers, with 81.8%.
- Quality scores (that assess the customer service provided by a live agent) for Councils were 64.2%, the highest of all industry sectors, with scores ranging from 49.5% (Monash Council, Victoria) to 71.7% (Launceston Council, Tasmania).
ACCESS RESULTS Q1 2024
Accessibility scores (how easy it was to get through to a live person) across the Australian Council sector were rated as ‘Met Standard’ with a score of 63.5%, marginally below the Q4 2023 result of 65.5%.
- For Q1 2024, the City of Casey (Vic) was the most difficult to get through a live agent with a score of 0.6%, the lowest Nationally of all call centres we assessed. This is the fourth consecutive month we have been unable to get any of our calls answered within a 15-minute wait time, suggesting there are systemic resourcing issues and high levels of frustration for ratepayers trying to contact the council via the call centre.
- Across the Council sector, 19.8% of calls we made were not answered in Q1 2024 within our 15-minute threshold, primarily due to the City of Casey (Vic) failing to answer 100% of our calls and the City of Stirling (WA) failing to answer 38.9% of our calls.
- Only two Councils have answered 100% of all our calls since we commenced in August 2023, Brisbane City Council (QLD) and Onkaparinga Council (SA).
- Average wait times across all Councils increased from Q4 2023 (04:16 minutes) to 04:23 minutes in Q1 2024.
- City of Onkapringa (SA) had the lowest average wait time for Q1 2024 of 00:28 minutes.
- City of Casey (Vic) had the longest wait times of 15:00 minutes (the point at which we terminate the call) meaning actual wait times for ratepayers would have been longer.
- Of the Councils we assessed, 57% had no IVR at all (press one for this, two for that), with the City of Stirling (WA) having the most menu layers of 2.0.
- In addition to making menu selections, customers were forced to listen to recording messages prior to reaching a live agent ranging from 00:00 minutes (Monash Council, the only Council with no recorded messaging) through to City of Casey (Vic) at 00:47 minutes.
- A number of Councils had excessively repeated messages playing while waiting on hold, repeating more than once every 30 seconds, with the City of Casey (100% of calls) and Stirling Council (77.8% of calls) being the highest.
- Talk time averaged 03:09 minutes across all Councils in Q1 2024 (up 00:03 minutes from Q4 2023), ranging from 02:12 minutes (Monash Council, Vic) to 04:13 minutes (City of Onkaparinga, SA).
QUALITY RESULTS Q1 2024
The Quality of customer service provided by Australian Councils is measured against the Australian Contact Centre Quality Standards and in Q1 2024, the Council sector was rated as ‘Met Standard’ with a score of 64.2%, the highest quality score of any industry sector.
Since we commenced our mystery shopping assessments in August 2023, the councils have led the Quality scores for all industry sectors.
- Quality Scores for Councils in Q1 2024 ranged from 49.5% (Monash Council, Vic) to 71.7% (Launceston Council, Tas).
- City of Casey (Vic) did not receive a quality score as we were unable to connect to a live agent for the fourth consecutive month.
- Of the five Quality Competencies we assessed using the Australian Contact Centre Quality Standards, the ‘Energy’ competency was the highest-rated and a clear strength, with a score of 88.9%. The ‘Energy’ competency assesses empathy, clarity and efficient call management that builds connection and makes it easy for the customer to get what they need with scores ranging from 77.8% (Monash Council, Vic) to 97.2% (Launceston Council, Tas).
- By contrast, Councils had the lowest score of all industry sectors for the ‘Close’ competency, 52.2%, which assesses control at the end of the call with a strong final check and expression of gratitude and thanks to create a strong final impression. Scores ranged from 25.9% (Monash Council, Vic) to Onkaparinga Council (SA), 66.7%.
- Using the customer’s name during the conversation, one of the four ‘Engage’ behaviours we assess, was ranked at just 7.4% in Q1 2024 for the Council sector, the lowest result of all industry sectors, with three Councils scoring 0% for the entire quarter.
- There were no deductions for major audio issues or distractions observed in Q1 2024 across any of the Councils.
Call Centre Rankings Key:
POOR
BELOW STANDARD
MEETS STANDARDS
EXCEEDS STANDARD
OUTSTANDING
OVERALL RANKINGS – Q1 2024, AUSTRALIAN COUNCILS
*The Overall Rankings are determined by the Access Score and Quality Score, with a higher weighting applied to the quality of the call. Deductions/penalties are applied for metrics that impact the customer’s experience, such as technical glitches, audio quality, and a failure to answer calls within our 15-minute threshold.
ACCESS SCORES – Q1 2024, AUSTRALIAN COUNCILS
The Call Centre Access Rankings rate how easy it was for customers wanting to speak to a live person to discuss local issues with their Council.
59 individual elements are assessed, capturing the entire experience before interacting with a live agent including queue wait times, how easy it was to find the phone number, the number of menu options (i.e. press 1 for this, 2 for that), messaging times, hold music, audio quality and lots more.
Mystery Shopping calls to Councils are terminated if wait times exceed 15:00 minutes.
QUALITY SCORES – Q1 2024, AUSTRALIAN COUNCILS
Whilst average wait times are typically longer for the Councils than other industry sectors, it’s still what happens during the call that can have a large influence on the satisfaction of the customer.
Recent CX Statistics continue to highlight the importance of the live interaction with a customer service employee, and the preference to speak to a live agent rather than an automated chatbot/AI etc.
The Australian Contact Centre Quality Standards have been developed and refined over 30 years, and when businesses consistently achieve high ratings in these core competencies, there is a direct correlation to improved business metrics however you measure them – Sales Conversions, NPS, Customer Effort Score, improved efficiency, reduced AHT etc.
The standards apply to all contact centres and are adapted to customer service or sales calls.
Quality is assessed across five core competencies and 18 call-handling behaviours that directly correlate to better customer and business outcomes: Engage, Discover, Educate, Close, Energy.
Learn more about the Australian Contact Centre Quality Standards >
DEDUCTIONS – Q1 2024, AUSTRALIAN COUNCILS
Deductions are applied to the overall scores if there are moments that can negatively impact the customer experience, including excessive queue messages, technical glitches, menu navigation challenges, audio distractions, etc.
A low score (i.e. 0.0%) means there were no deductions applied.
LIFETIME AVERAGES – AUSTRALIAN COUNCILS
The lifetime averages for six metrics, displaying the top three Councils, the Council with the lowest score, and the lifetime sector average.
ACXPA MEMBERS QUARTERLY REPORT DOWNLOAD ⬇️
Download a quarterly report that contains Council sector averages for 40 metrics plus the averages for 23 individual metrics for three random Councils each quarter.
What type of scenarios do we use to conduct the Mystery Shopping calls?
We use enquiries that are general in nature and don’t require us to disclose personal information, such as rubbish, rates, services, etc.
How does the scoring work?
Over the past 30 years, we’ve developed standards based on consumer preferences and the metrics that matter – the ones that can influence the customer experience.
You can learn more about the framework we use here >
How many calls are assessed?
For the public monthly report, we include at least three calls per council per month. – as more councils sign up for the service, more calls will be included.
When you purchase the Contact Centre CX Benchmarking service, you will receive a minimum of six calls assessed for every council included.
If you’d rather have a larger sample size, please refer to our customised Benchmarking service >
How can we improve our score?
Our Mystery Shopping program has been designed to provide Councils with the insights they need to improve performance!
You’ll receive detailed information on your performance against over 80 individual elements, so you know exactly where to focus, and we also include a quarterly report that provides you with personalised key recommendations on areas to focus on.
We also offer a range of training courses that can help teach your frontline employees the skills they need to deliver great customer service (Customer Service Phone ‘Essentials‘ & ‘Professional‘), as well as training courses for your Team Leaders/Managers so they know how to coach effectively using the Quality Framework to improve your performance (and scores!).
How do I get my contact centre included?
We have a fixed-price service starting from $1,297 per month that will provide you with over 80 metrics on the performance of your contact centre, and benchmarking data for any five councils you can nominate. Learn more >
How do I order the service?
We have an online ordering form that makes it easy to order the service, nominate the councils you’d like to benchmark against, who you’d like the reports to be sent to, etc. View the online order form >
How do I access the data for councils?
ACXPA Business Members get full access to the summary monthly data for councils (and other sectors) along with a host of other benefits, which contains the data for three random councils each month.
An ACXPA Business Membership starts from just $497 per year and includes five individual memberships you can allocate to key employees who could benefit from gaining access to leading industry insights for contact centres, customer experience (CX), digital service, and in-person customer service.
If you sign your council up to the Contact Centre CX Benchmarking Service, you will gain access to ALL data from ALL councils.
Is there someone I can speak to to learn more?
Absolutely! If you’d like to speak to someone further about the Benchmarking Service, please get in touch with our General Manager of Quality Insights, Simon Blair directly on 0407 002 113 or simon@acxpa.com.au, or call us on 03 9492 2871.
What type of scenarios do we use to conduct the Mystery Shopping calls?
We use general enquiries that don’t require us to disclose personal information such as rubbish, upcoming events, rates etc.
Why don’t your results align with my experience?
Despite the perception, call centres are complex operations involving lots of people, processes, technology and the random nature of call arrival as we don’t know when people are going to call!
Even with the best planning, this can result in a varying level of performance depending on a wide range of factors, including the time of day, whether everyone who was rostered attended work, whether the number of calls forecasted is accurate, and much more.
In addition, calls for service can be treated very differently than sales, and many call centres have the technology to alter the priority of calls answered depending on their nature, previous history, status within the organisation, and so on.
All of these factors can result in a much different experience every single time you call a contact centre.
As we’ve mentioned though, most customers don’t really care about any of that and will make their decision based on their phone call only – and our mystery shopping is designed to capture that – a snapshot of what customers are experiencing.
Finally, we are also unable to test the experience for existing customers. To maintain the anonymity of mystery shopping, we cannot provide account details, etc., which many call centres now require before being placed into the queue.
And frustratingly, its often the existing customers who receive the worst experience 😱
Do councils really care about the service they provide?
We’d really like to say yes! But sometimes, due to a lack of resources or skills, the customer experience delivered falls well below expectations.
When Councils focus on delivering a better customer experience, it is not only good for you but also makes them more efficient, meaning they can invest in more services for you.
How do I get my Council included?
We encourage you to contact your local Mayor and ask them to include your Council. Just send them a link to this page!
Why does ACXPA publish results each month?
Our mission is to improve the level of customer experience in Australia, so by publishing the results monthly, we’ll continue to ensure that councils are accountable for the level of customer service they provide to their ratepayers.
What type of services does ACXPA offer?
In addition to the Mystery Shopping CX Benchmarking, we offer a range of services and resources for people working in contact centres, customer experience (CX), digital service and in-person customer service/retail. You can learn more about us here >
Purchase exclusive insights for your Council
If you’d like to gain Voice of Customer (Voc) insights specifically for your contact centre and benchmark your results against other Councils, we offer a cost-effective, fixed-price benchmarking service that makes it easy!
Starting from just $1,297 per month, by purchasing our Contact Centre CX Benchmarking Service, you’ll receive the following:
- Six Mystery Shopping calls into your call centre each month at random times and days where you’ll receive the full assessment against 48 metrics, our quality assessor’s notes, the employee’s name (where provided) and the full call recordings.
- Benchmarking data for any five Councils you nominate, so you can benchmark your performance against other Councils that matter the most to you.
- Council Sector Averages from all the other Councils we assess providing you with sector-wide results to further compare your results to.
- A monthly email with data to track your performance along with the call recordings.
- A quarterly report containing insights and trends that are easy to understand, along with actionable recommendations to help improve your performance.
- An optional Quarterly Insights workshop for your team (conducted live via Zoom) that can provide additional insights, coaching and guidance.
- Access to training to help you improve results.
Upcoming ACXPA Member Bites Sessions
Short, sharp interviews and presentations on specific topics to fast-track your knowledge!
The ACXPA Member Bites are only available to ACXPA Members!
ACXPA Members can watch all the ACXPA Member Bites at any time in their Video Library. Discover which membership is right for you >

IVR Best Practice
Over 90% of contact centres are using an IVR (Press 1 for this, press 2 for that), and we've encountered many contact centres with over four layers of options for customers to select from. In this session, Nadine will be sharing some best practice tips on IVR design for 2024.
Presented by Nadine Power, Client Success Manager, VERSA Connects (and ACXPA National Advisory Board Member)
More sessions announced soon!
(If you're interested in speaking at one of our events, click here to learn more >)
- About the Author
- Latest Articles
ACXPA connects contact centres, customer experience, digital experience, customer service and employee experience professionals in Australia to create better customer, business, career and industry outcomes.
By joining, you’ll gain access to global best practices, leading industry insights, world-class training and an unrivalled community of industry professionals.

