Australian Call Centre Industry Rankings October 2023
Executive Summary
Our first Call Centre Ranking National report was published in August 2023 and started with assessing five industry sectors: Banks, Councils, Energy Providers, Internet Providers and TAFEs. For this Australian Call Centre Industry Rankings October 2023 report, we’ve added a new industry sector: Car Insurance.
You can learn more about our assessment methodology, but in summary, we conduct a series of mystery shopping calls at random times and days, posing as a real customer, and then we assess the call using 48 different metrics that provide us with three key scores:
- The Accessibility Score captures how easy it was to connect to a live contact centre agent including wait times, complexity of IVR Menus, hold experience, etc.
- The Quality Score (QIS) measures the experience received during the interaction with the live contact centre agent using the five core competencies from the Australian Contact Centre Quality Standards: Engage, Discover, Educate, Close and Energy.
- The Overall Score combines the two scores above with proprietary weightings on the competencies that influence the customer experience the most, and it’s this score that is used to determine the overall ranking results.
Key Findings from the Australian Call Centre Industry Rankings October 2023 Report
For each industry sector, we randomly selected a minimum of six different businesses with the key observations including:
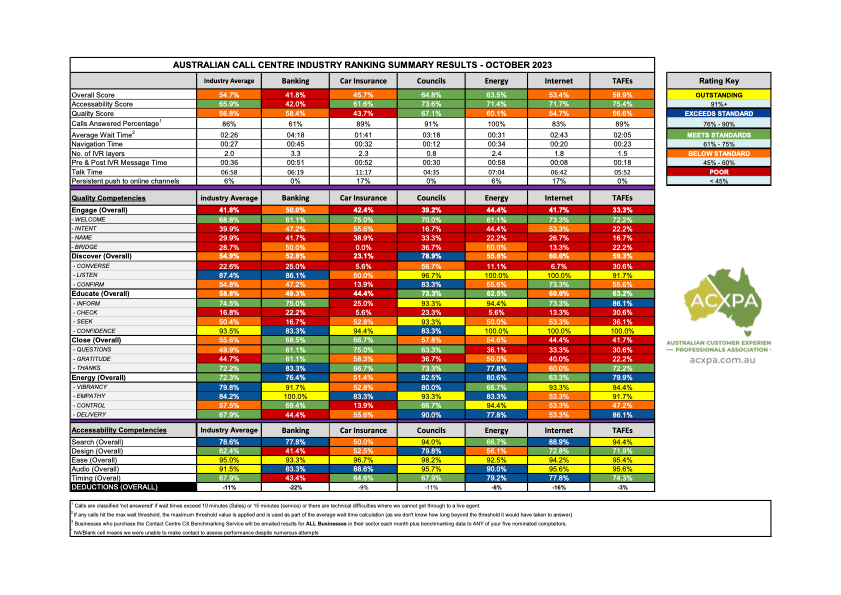
- The Councils were ranked as the best overall sector (64.8%), with the Banks the lowest ranked of the industry sectors (41.8%) for the third consecutive month.
- Only one industry sector, Energy Providers, answered 100% of the mystery shopping calls within our thresholds (10 minutes for sales calls, 15 minutes for customer service calls). The worst performing sector was the banks, failing to answer 39.9% of calls we made to banks, delivering a poor experience for potential new customers and missed opportunities for the banks to convert those calls into new business.
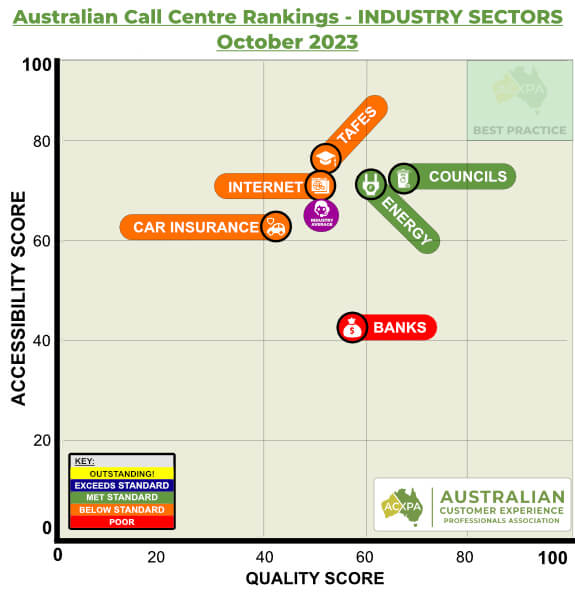
- When it comes to being able to connect to a live agent, the TAFEs were rated the best for Accessibility (75.4%) with the Banks again the lowest-ranked sector (42.0%) for the third consecutive month.
- Quality was rated as ‘Below Standard’ across the industry averaging 56.8% (- 2.6% from September 2023) 59.4%, with the Councils the lead sector at 67.1% and the new sector, Car Insurance, rated the lowest for quality with 43.7%.
- Average Wait Times across the industry was 02:26 minutes, an increase of 00:20 minutes from the previous month. The quickest wait times were delivered by the Energy Providers (00:31 minutes), and the longest wait times on average were the Banks (04:18 minutes).
- Navigation time (of the IVR menu where present) averaged 00:27 minutes, a decrease of 00:08 minutes from September 2023. Councils had the shortest menu navigation times (00:12 minutes) and Banks the longest (00:45 minutes).
- Customers also endured an average of 00:36 minutes of recorded announcements before being placed in a queue, with the Internet Providers the shortest (00:08 minutes) and the Energy Providers the longest (00:58 minutes).
- When it comes to the number of IVR layers, the Banks had the most, with an average of 3.3 layers, compared to the Councils, with the lowest at 0.8.
Jump Straight to a Section:
Key Results by Industry Sector
Overall Score Rankings by Sector
Accessibility Score Rankings by Sector
Quality Score Rankings by Sector
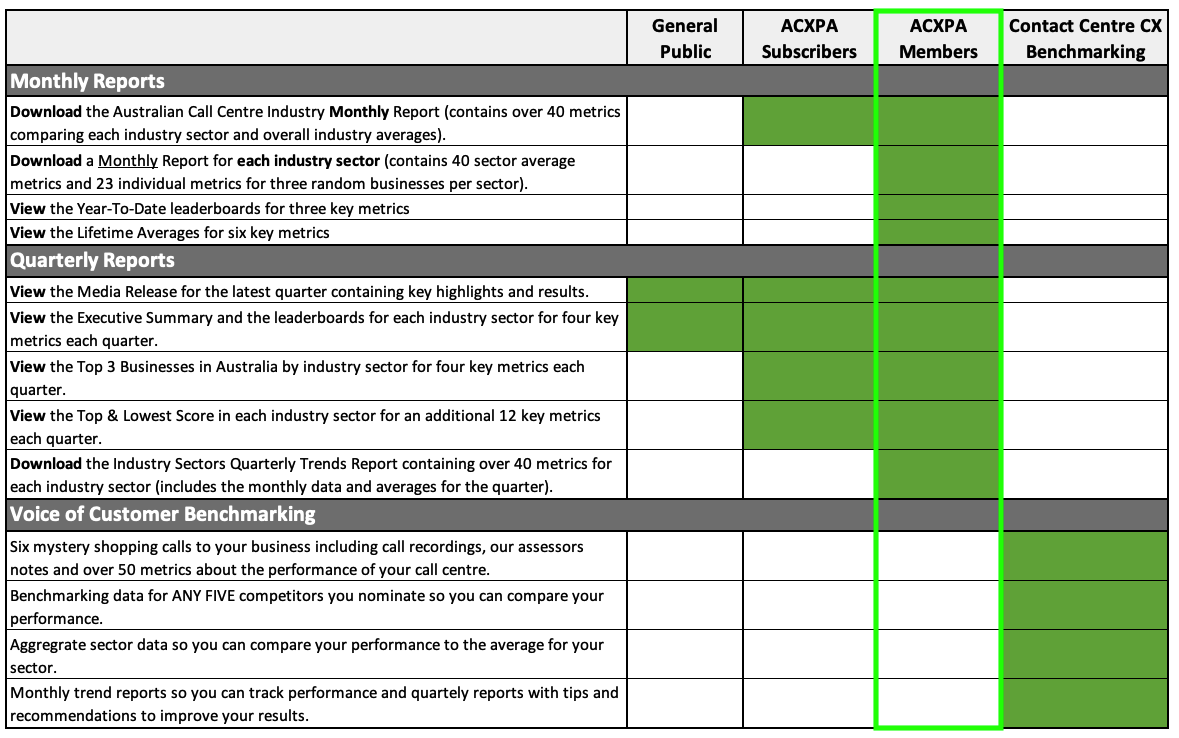
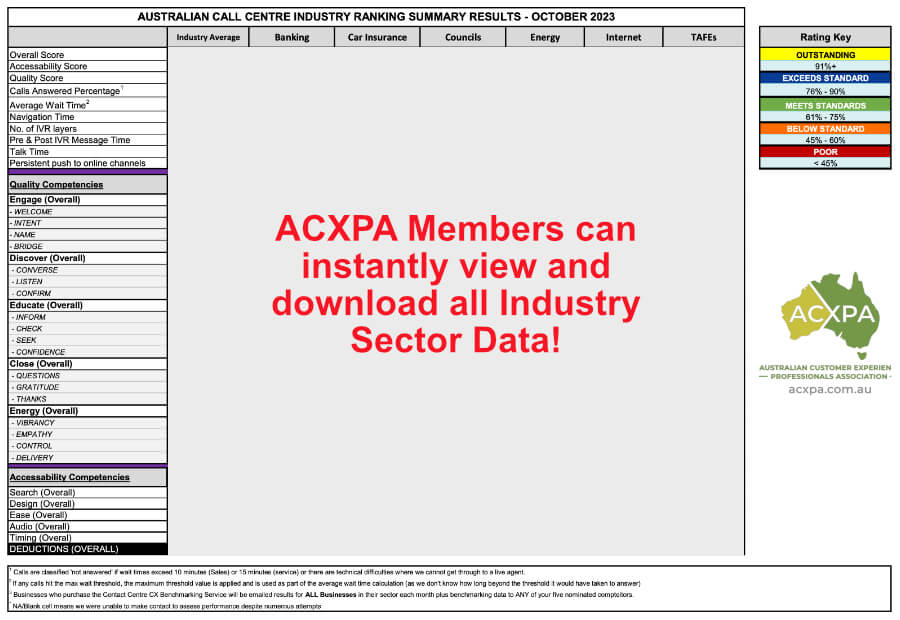
Calls Answered Percentage by Sector (ACXPA Members only)
Menu Navigation Times by Sector (ACXPA Members only)
Pre-Recorded Message Times by Sector (ACXPA Members only)
Average Talk Times by Sector (ACXPA Members only)
Australian Call Centre Quality Rankings:
POOR
(<45%)
BELOW STANDARD
(45% to 60%)
MEETS STANDARDS
(61% to 75%)
EXCEEDS STANDARD
(76% to 90%)
OUTSTANDING
(>91%)
Key Results by Industry Sector for October 2023
The tables below rank the various industry sectors we assessed across four key metrics.
[leaderboard id=’274′]
[leaderboard id=’275′]
[leaderboard id=’276′]
[leaderboard id=’277′]
Overall Score Rankings by Sector (October 2023)
Each sector had some stand-out performers, with a special mention to the Holmesglen TAFE in Victoria, which was the top-rated contact centre in Australia for October 2023 with a score of 85.6%.
2nd place was awarded to Northern Beaches Council (82.9%) and 3rd place, the City on Onkparinga (79.5%) who were the overall winners the previous two months.
The Overall Score is determined by combining the two primary component scores below and applying some proprietary weightings that place a higher emphasis on the quality of the interaction:
- Accessibility Score – measures the experience of connecting to a live contact centre agent.
- Quality Score – measures the experience of the interaction with a contact centre agent.
[leaderboard id=’278′]
[leaderboard id=’280′]
[leaderboard id=’279′]
[leaderboard id=’281′]
[leaderboard id=’282′]
[leaderboard id=’283′]
Accessibility Score Rankings by Sector (October 2023)
Connecting to a live contact centre agent was easy in October 2023 was more difficult as compared to the September 2023 results, decreasing from 69.1% to 65.9%.
- Energy Providers were the biggest improver (+13.4%).
- TAFEs had the largest decrease (-12.6%) with a score of 75.4%, however this was still the best result for all of the sectors we assessed.
- For the third consecutive month, the Banks were assessed as the most difficult sector to connect to a live contact centre agent with a score of 42.0%, the only sector to achieve a ‘Poor’ rating.
- A large contributor to the ‘Poor’ rating for banks was:
- 39.1% of calls to banks (for sales-related calls) were not answered due to delays in excess of 10 minutes, representing lost revenue opportunities for them.
- Banks had the longest wait times of all industry sectors, with customers waiting, on average, 04:18 to connect to a live agent.
- On average, customers were forced to listen to 00:36 minutes of pre-recorded messaging before being able to speak to a live agent, an increase from September 2023 of 00:06 minutes. Internet Providers had the shortest messaging (00:08 minutes) and Energy Providers the longest (00:58 minutes).
- The average time stuck in an IVR (press 1 for this, 2 for that) was 00:27 minutes (down from 00:08 minutes the previous month), with Councils having the the quickest menus to navigate (00:12 minutes) and Banks the longest (00:45 minutes).
- The average wait time across the industry increased by 15.8% (02:06 minutes to 02:26 minutes), with the best sector the Energy Providers (00:31 minutes) and Banks the longest (04:18 minutes)
- Across all the contact centres we assessed, 14.6% had no IVR.
The Accessibility Score measures the experience before interacting with a live agent with our assessment including 30 individual elements grouped into five core components: Search, Design, Ease, Audio and Timing (along with deductions for calls not being answered within thresholds, technical glitches, etc).
Elements including queue wait times, ease of menu options (i.e. press 1 for this, 2 for that), hold music, audio quality, etc.
*We wait on hold for 10 minutes (sales scenarios) or 15 minutes (service scenarios) before disconnecting the call.
[leaderboard id=’284′]
[leaderboard id=’285′]
[leaderboard id=’286′]
[leaderboard id=’287′]
[leaderboard id=’288′]
[leaderboard id=’289′]
Quality Score Rankings by Sector (October 2023)
Across the industry, Quality declined to 56.8% which is rated as ‘Below Standard’.
As many of the mystery shopping calls we make are new revenue opportunities, this suggests there is a significant opportunity for organisations who invest in improving the performance of their contact centre employees.
- The best Quality across the industry was delivered by the Councils (67.1%), the second consecutive month leading the industry and the highest quality score recorded to date for any sector.
- The lowest quality was delivered by our newest sector, Car Insurance providers with a score of 43.7% the lowest score we have ever recorded for an industry sector.
- The TAFE sector had the largest improvement compared to the previous month (+4.7%).
- The ‘Engage’ Competency continued to be the worst performing competency and the only one rated as Poor (41.8%), with even basic things like the correct use of a customer’s name only scoring 29.9%.
- The top Quality Competency was ‘Energy’ with 72.3%.
- You can view more insights on the quality competencies further down in the report (or click here to jump to it)
The Quality Insights Score (QIS) measures the experience a customer has when interacting with a contact centre agent for either a customer service or sales call.
Quality is assessed across five core competencies and 18 call-handling behaviours that directly correlate to better customer and business outcomes.
Learn more about the Australian Contact Centre Quality Standards >
[leaderboard id=’290′]
[leaderboard id=’291′]
[leaderboard id=’292′]
[leaderboard id=’293′]
[leaderboard id=’294′]
[leaderboard id=’295′]
Average Wait Times by Sector (October 2023)
The average wait time across the industry increased by 28% (02:06 minutes down to 02:26 minutes), with the best sector in October 2023 the Energy Providers (00:31 minutes) and Banks the longest (04:18 minutes).
- Energy Providers was the only sector that a decrease in wait times compared to the previous month, a decrease of 01:01 minutes to 00:31 minutes.
- Councils has the largest increase in wait times (+01:44 minutes to 03:18 minutes).
- Banks has the longest wait times (04:18 minutes) for the third consecutive month.
You can view the leaders for each sector in the tables below.
The Average Call Centre Wait Times in Australia measures the time to connect to a live call centre employee in Australia after navigating the IVR systems (press 1 for this, press 2 for that) and listening to any pre-recorded messaging.
Most people would refer to this as waiting in a call centre queue, and it’s often the measure that has the highest correlation to customer frustration.
Mystery Shopping calls are terminated at 10:00 minutes for sales calls and 15:00 minutes for customer service calls.
As we disconnect, we don’t capture the total wait time. The max threshold time is used to calculate the averages, meaning when wait times exceed the threshold, the actual wait times would be higher than the reported average.
Industry Average
Fastest Sector: Energy Providers
Longest Sector: Banks
[leaderboard id=’296′]
[leaderboard id=’297′]
[leaderboard id=’298′]
[leaderboard id=’299′]
[leaderboard id=’300′]
[leaderboard id=’301′]
How many contact centres do you assess in each sector?
Each month we do a snapshot of the industry and typically mystery shop a minimum of six different businesses in each sector.
How do you assess the contact centres?
We conduct Mystery Shopping calls posing as a real customer and then assess the call against 48 different performance metrics.
Learn more about how we assess performance >
Can I get the data for each contact centre that was assessed in each sector?
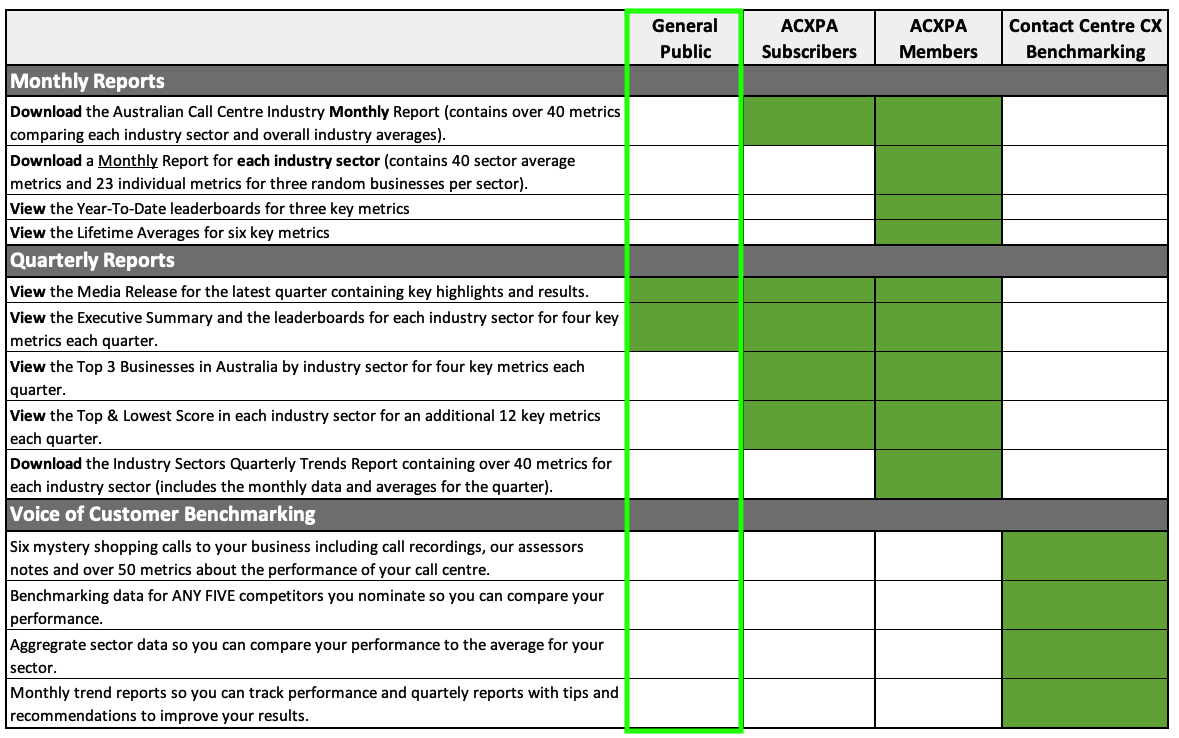
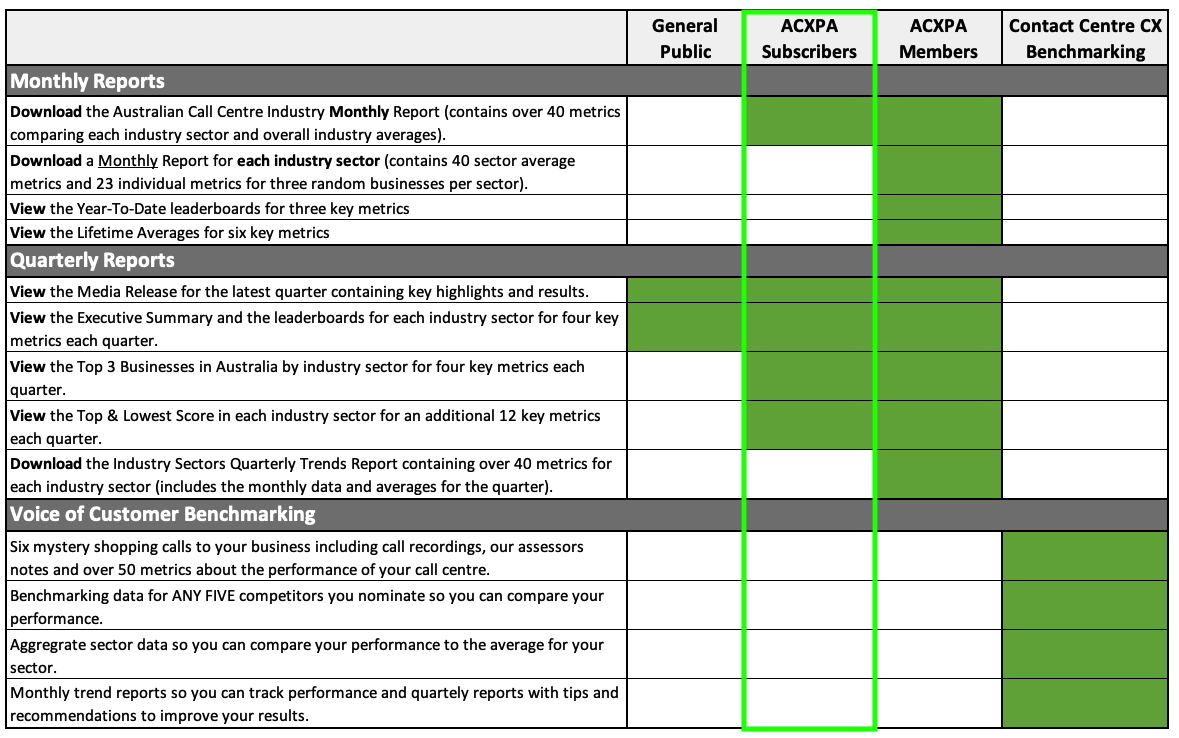
Yes, businesses that purchase the Contact Centre CX Benchmarking Service receive data on all the contact centre centres assessed in the same sector as you (we guarantee a minimum of five other competitors you can benchmark against).
How many mystery shopping calls do you conduct for each business?
A real customer makes their assessment off the single call they make – they don’t care about averages and minimum sample sizes – their entire judgement will be made from that one call. Harsh, but true! And that’s what we want to capture in our Call Centre Rankings, what real customers are experiencing.
However, at a minimum, for all our public reports we will conduct at least three different calls at different times and days to each business.
Learn more about how we assess performance >
Is there a way to ensure my contact centre is included?
Yes, if you purchase our Contact Centre CX Benchmarking Service your business will be automatically included in the rankings each month.
I didn’t see my business sector – is there a way to get benchmarking data for my business sector?
Yes! If you purchase our Contact Centre CX Benchmarking Service for your contact centre, your sector will be added to our ranking reports! And just like the other sectors we publish data for, we’ll include at least six contact centres for each industry sector.
Is there trend data available?
Yes. We started publishing reports in August 2023 – view the YTD data >
View Additional Information By Industry Sector:
Each Industry Sector has its own YTD and monthly reports – click the button below to view specific industry data.

