Australian Call Centre Rankings September 2023 (by Industry Sectors)
Executive Summary
Our first Call Centre Ranking National report was published in August 2023, so this Australian Call Centre Rankings September 2023 report is our second, assessing 35 different contact centres across 5 industry sectors; Banks, Councils, Energy Providers, Internet Providers and TAFEs.
You can learn more about the methodology, but in short, we conduct a series of mystery shopping calls at random times and days posing as a real customer, and then we assess the call using 48 different metrics that provide us with three key scores:
- The Accessibility Score captures how easy was it to connect to a live contact centre agent assessment elements including wait times, complexity of IVR Menus, hold experience etc.
- The Quality Score (QIS) measures the experience received during the interaction with the live contact centre agent using the five core competencies from the Australian Contact Centre Quality Standards: Engage, Discover, Educate, Close and Energy.
- The Overall Score combines the two scores above with proprietary weightings on the competencies that influence the customer experience the most, and it’s this score that is used to determine the overall ranking results.
Key Findings from the Australian Call Centre Rankings September 2023 Report
For each sector, we randomly selected a minimum of six different businesses with the key observations including:
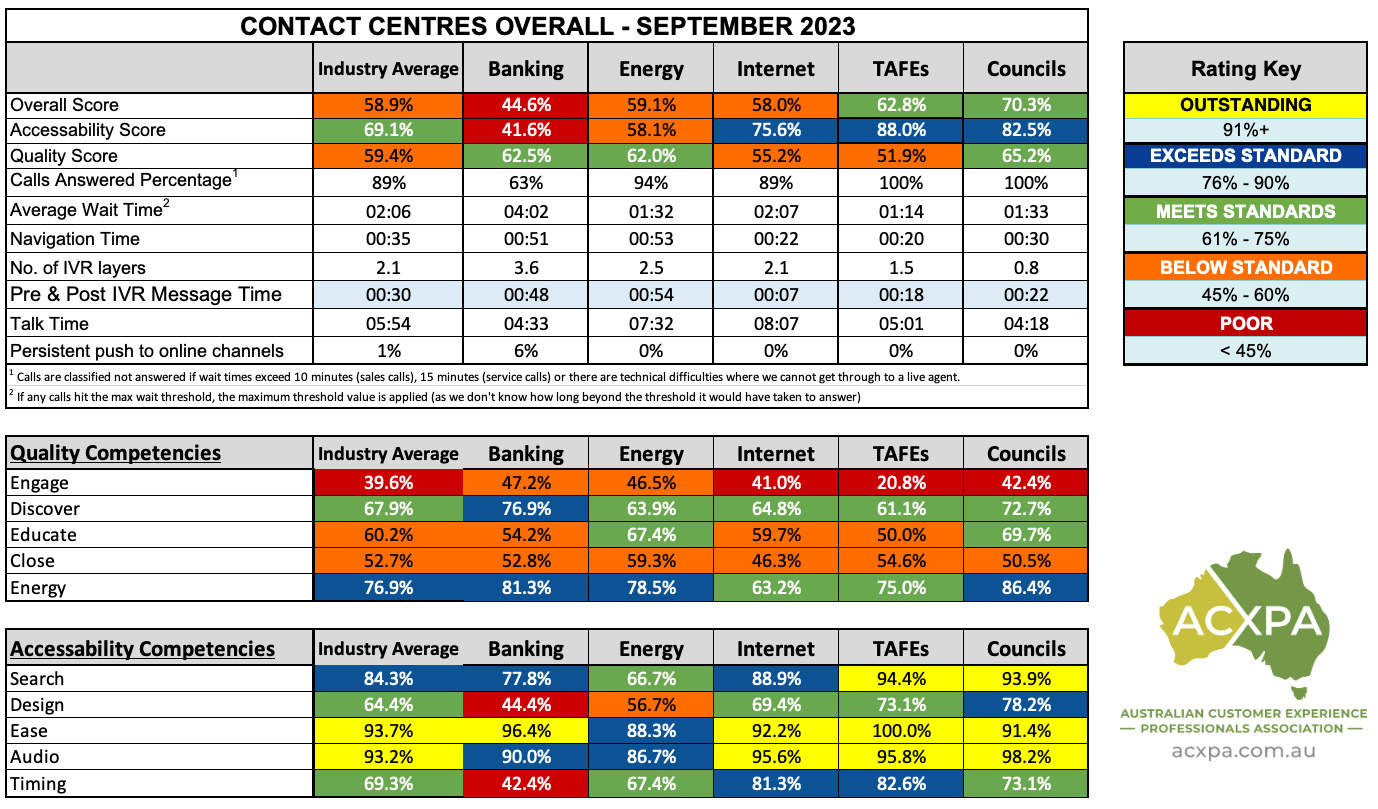
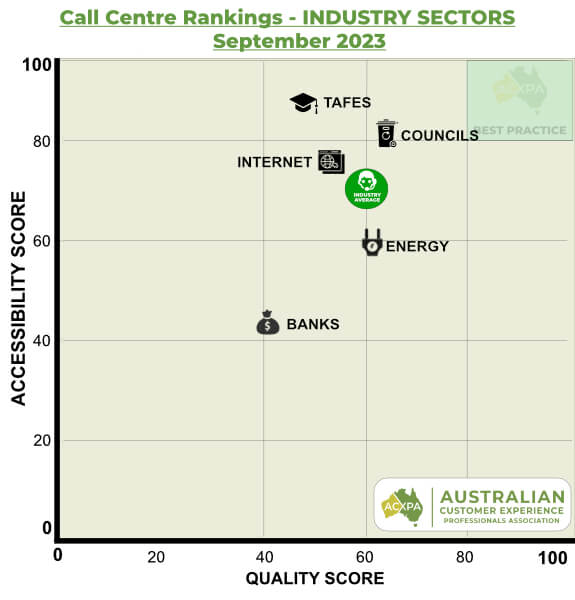
- The Councils took out the best overall sector (70.3%), with the Banks the lowest ranked of the industry sectors (44.6%).
- 37% of calls to banks (for sales-related calls) were not answered within our 10-minute threshold, representing missed opportunities to convert those calls into new business.
- TAFEs were rated the best for Accessibility (82.5%) with the Banks againt the lowest performing sector (41.6%).
- Quality was rated as ‘Below Standard’ across the industry averaging 59.4%, with the Councils the lead sector on 65.2%.
- Average Wait Times across the industry was 02:06 minutes, the quickest to answer were the TAFES (01:14 minutes) and the longest wait times on average were the Banks (04:02 minutes)
- Navigation time (of the IVR menu where present) averaged 00:35 minutes, with the TAFES having the shortest menu navigation (00:20 minutes) and Banks the longest (00:51 minutes).
- Either pre or post navigating the menu, customers also endured an average of 00:30 minutes of annoucements before being placed in a queue, with the Internet Providers the shortest (00:07 minutes) and the Energy Providers the longest (00:53 minutes).
- When it comes to the number of IVR layers, the Banks took out the title of the longest, with an average of 3.6 layers, compared to the Councils with the lowest at 0.8.
Jump Straight to a Section:
Key Results by Industry Sector
Overall Score Rankings by Sector
Accessibility Score Rankings by Sector
Quality Score Rankings by Sector
Calls Answered Percentage by Sector (ACXPA Members only)
Menu Navigation Times by Sector (ACXPA Members only)
Average Talk Times by Sector (ACXPA Members only)
Australian Call Centre Quality Rankings:
POOR
(<45%)
BELOW STANDARD
(45% to 60%)
MEETS STANDARDS
(61% to 75%)
EXCEEDS STANDARD
(76% to 90%)
OUTSTANDING
(>91%)
Key Results by Industry Sector for September 2023
The tables below rank the various industry sectors we assessed across four key metrics.
[leaderboard id=’83’]
[leaderboard id=’84’]
[leaderboard id=’85’]
[leaderboard id=’119′]
Overall Score Rankings by Sector (September 2023)
Each sector had some stand-out performers, with a special mention to the City of Onkaparinga, which was the top-rated contact centre in Australia for the second consecutive month with a score of 83.5%, with 2nd place awarded to Simply Energy (79.2%) and 3rd place iiNet (76.2%).
[leaderboard id=’27’]
[leaderboard id=’28’]
[leaderboard id=’29’]
[leaderboard id=’30’]
[leaderboard id=’31’]
Accessibility Score Rankings by Sector (September 2023)
Connecting to a live contact centre agent was easy in September as compared to the August 2023 results, improving from 60.3% to 69.1%, with all sectors recording an improvement.
- Councils were the biggest improver (+12.2%), followed by the Banks (+11.9%).
- Whilst the Banks did record an improvement, they were still the lowest rated of all industry sectors and the only sector to achieve a ‘Poor” rating with 41.6%.
- 37% of calls to banks (for sales-related calls) were not answered due to delays in excess of 10 minutes, representing lost revenue opportunities for them.
- Pre and post-IVR Messaging took, on average, 00:30 minutes, with Internet Providers the shortest messaging (00:07 minutes) and Energy Providers the longest (00:54 minutes).
- The average time stuck in an IVR (press 1 for this, 2 for that) was 00:35 minutes (down from 00:43 minutes the previous month), with Internet Providers the quickest to navigate (00:20 minutes) and Energy Providers the longest (00:53 minutes).
- The average wait time across the industry was reduced by 28% (02:57 minutes down to 02:06 minutes), with the best sector the TAFES (01:14 minutes) and banks the longest (04:02 minutes)
[leaderboard id=’120′]
[leaderboard id=’121′]
[leaderboard id=’122′]
[leaderboard id=’123′]
[leaderboard id=’124′]
[leaderboard id=’125′]
[leaderboard id=’126′]
[leaderboard id=’127′]
[leaderboard id=’128′]
[leaderboard id=’129′]
Quality Score Rankings by Sector (September 2023)
There was a modest improvement in quality across the industry (+6.2%); however, overall, the industry is still rated as ‘Below Standard’ with 59.4%.
Given many of the calls we make are new revenue opportunities, this suggests there is a significant opportunity for organisations to improve their results with improved training.
- The Banks led the way with the biggest improvement compared to the previous month (+17.8%).
- The best Quality across the industry was delivered by the Councils (65.2%) with TAFE’s the lowest rated for quality at 51.9%.
- The ‘Engage’ Competency continued to be the worst performing competency and the only one rated as Poor (39.6%), suggesting that frontline employees are not well equipped at building a strong first impression with the customer.
- The top competency was ‘Energy’ rated “Exceeds Standards’ the only competency to achieve this rating.
- You can view more insights on the quality competencies further down in the report (or click here to jump to it)
Learn more about the Australian Contact Centre Quality Standards >
[leaderboard id=’130′]
[leaderboard id=’131′]
[leaderboard id=’132′]
[leaderboard id=’133′]
[leaderboard id=’134′]
[leaderboard id=’135′]
[leaderboard id=’136′]
[leaderboard id=’137′]
[leaderboard id=’138′]
[leaderboard id=’139′]
Average Wait Times by Sector (September 2023)
The average wait time across the industry was reduced by 28% (02:57 minutes down to 02:06 minutes), with the best sector the TAFES (01:14 minutes) and banks the longest (04:02 minutes).
- Councils had the largest reduction compared to the previous month (04:04 minutes down to 01:33 minutes).
- Internet Providers was the only sector with an increase (+01:16 minutes to 02:07 minutes).
You can view the leaders for each sector in the tables below.
Industry Average
Fastest Sector: TAFEs
Longest Sector: Banks
[leaderboard id=’140′]
[leaderboard id=’141′]
[leaderboard id=’142′]
[leaderboard id=’143′]
[leaderboard id=’144′]
[leaderboard id=’145′]
[leaderboard id=’146′]
[leaderboard id=’147′]
[leaderboard id=’148′]
[leaderboard id=’149′]
How many contact centres do you assess in each sector?
Each month we do a snapshot of the industry and typically mystery shop a minimum of five different businesses in each sector.
Can I get the data for each contact centre that was assessed in each sector?
Yes, businesses that join the Contact Centre CX Benchmarking Service receive data on all the contact centre centres assessed in the same sector as you (we guarantee a minimum of five other competitors you can benchmark against).
How many mystery shopping calls do you conduct for each business?
A real customer makes their assessment off the single call that they make – they don’t care about averages and minimum sample sizes – their entire judgement will be made from that one call. Harsh, but true.
At a minimum, we will conduct at least three different calls at different times and days to each business and we assess each call across over 40 different metrics.
Learn more about how we assess performance >
Is there a way to ensure my contact centre is included?
Yes, please refer to our Contact Centre CX Benchmarking Service which offers a fixed-priced model. Businesses that are subscribed to the service will have their results included in the published results each month.
I didn’t see my business sector – is there a way to get benchmarking data for my business sector?
Yes! If you join our Contact Centre CX Benchmarking Service, you’ll receive insights for your contact centre, plus five other competitors you nominate.
This will provide you with both industry sector information and some great insights into how to improve your own contact centre’s performance and how you compare against others in the industry. Learn more >
Is there trend data available?
Yes. We started publishing reports in August 2023 – view the YTD data >
View Additional Information By Sector:
Banks | Car Insurance | Councils | Energy Providers | Internet Providers | TAFES


